 Question Constellation Sign up for free
 AQA · GCSE · Biology · Higher
Cardiovascular Risk Bar Chart
| Cardiovascular disease | Percentage (%) increase in risk compared to people who have never smoked |
|---|---|
| E | 14 |
| F | 20 |
| G | 29 |
| H | 70 |
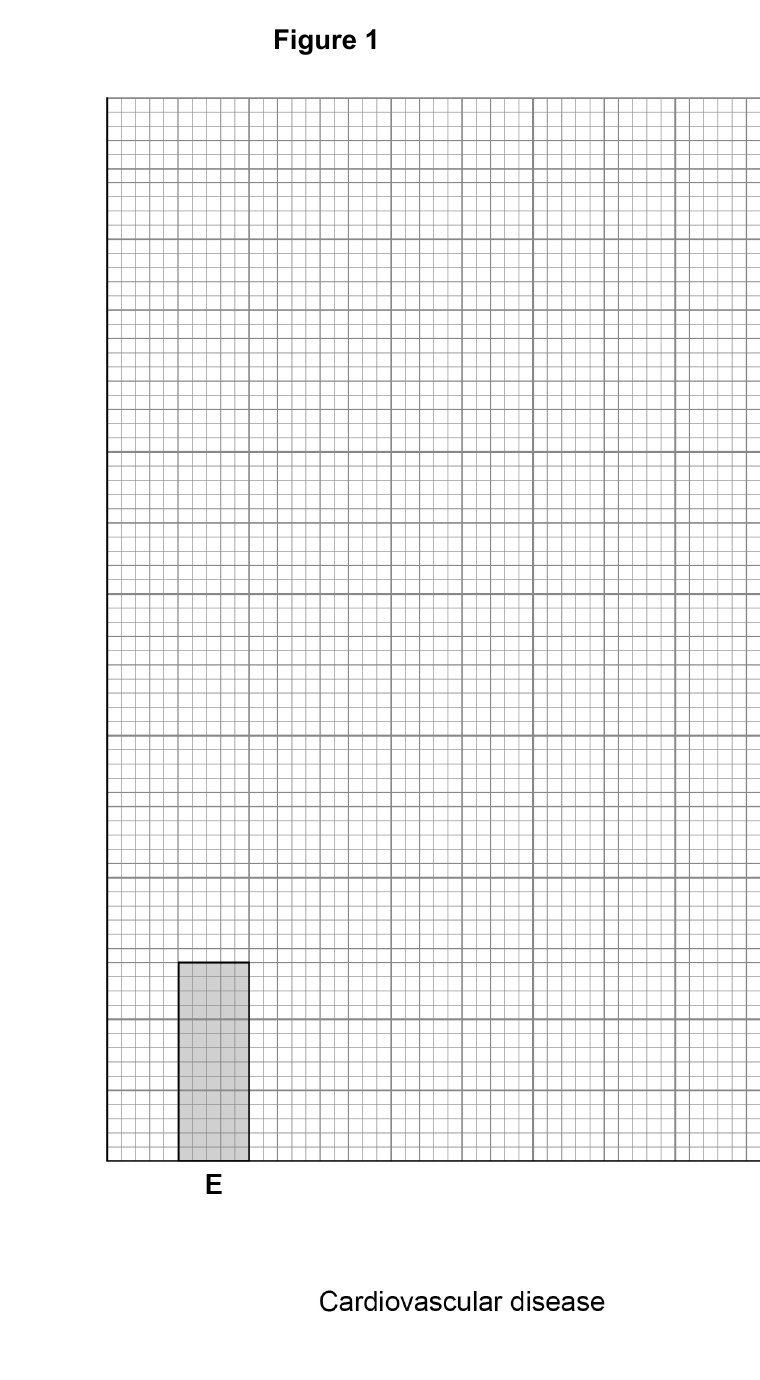
Complete Figure 1.
- label the y-axis
- add the correct scale to the y-axis
- plot the data from Table 1
- label each bar
The bar for cardiovascular disease E has been plotted for you.
Practice unavailable
This question can be viewed, but its original response format is not available for practice yet.
Write your answer first. You can study the marking guidance whenever you need it.
Study the marking See what earns credit and compare it with a full-mark answer.
Marking points
- 1 The y-axis has the correct percentage-increase label.
- 2 The y-axis scale is 1 cm = 5%.
- 3 The E, F, G and H values are plotted at 14, 20, 29 and 70 respectively.
- 4 Every bar is correctly labelled E, F, G or H.
Why this answer loses marks
I plotted the bars but left the y-axis as it was.
The plotted heights alone miss the vertical-axis label and a usable scale.