 Question Constellation Sign up for free
 AQA · GCSE · Biology · Higher
Tadpole survival percentage calculation
| Sample number | 0 weeks | 1 week | 2 weeks | 3 weeks | 5 weeks | 8 weeks |
|---|---|---|---|---|---|---|
| 1 | 11 | 17 | 8 | 9 | 5 | 0 |
| 2 | 15 | 11 | 12 | 7 | 0 | 5 |
| 3 | 23 | 16 | 14 | 10 | 7 | 3 |
| 4 | 11 | 14 | 16 | X | 4 | 4 |
| Totals | 60 | 58 | 50 | 32 | 16 | 12 |
Figure 4 represents the Table 1 total numbers of tadpoles against time. Its x-axis is time in weeks and its y-axis is total number of tadpoles; a curved line of best fit follows the Table 1 totals.
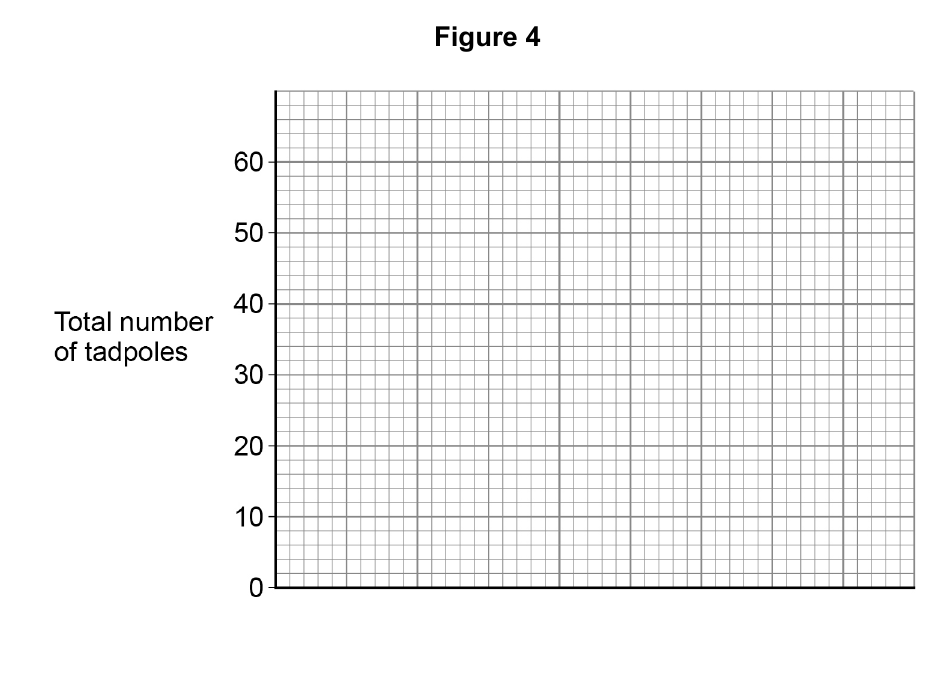
After 0 weeks, no more tadpoles hatched in the pond. Calculate the percentage of the tadpoles that would still be found in the pond at 4 weeks compared with 0 weeks. Use information from Figure 4.
Write your answer first. You can study the marking guidance whenever you need it.
Study the marking See what earns credit and compare it with a full-mark answer.
Marking points
- 1 Uses valid 0-week and 4-week readings from the plotted line (or the official no-line fallback values).
- 2 Divides the 4-week value by the 0-week value and multiplies by 100.
- 3 Gives a percentage consistent with the values used, such as 36.7% for 22 and 60.
Full-mark answer
A typical line of best fit gives about 60 tadpoles at 0 weeks and 22 at 4 weeks. Percentage remaining = (22 ÷ 60) × 100 = 36.7% (about 37%). A correct calculation from the learner's own valid graph readings is also accepted; the official no-line fallback using 24 and 60 gives 40%.
Why this answer loses marks
Find the decrease and divide it by the later reading.
The question asks for the percentage remaining, so use the target-time amount over the starting amount.