 Question Constellation Sign up for free
 AQA · GCSE · Chemistry · Higher
Explaining a zinc temperature graph
A student investigated the energy change of the reaction between zinc and copper sulfate solution.
- Measure 25 cm³ of copper sulfate solution into a polystyrene cup.
- Measure the temperature of the copper sulfate solution.
- Add 0.20 g of zinc powder to the copper sulfate solution.
- Stir the reaction mixture.
- Record the highest temperature reached.
- Repeat steps 1 to 5 with different masses of zinc powder.
Figure 3 shows the results.
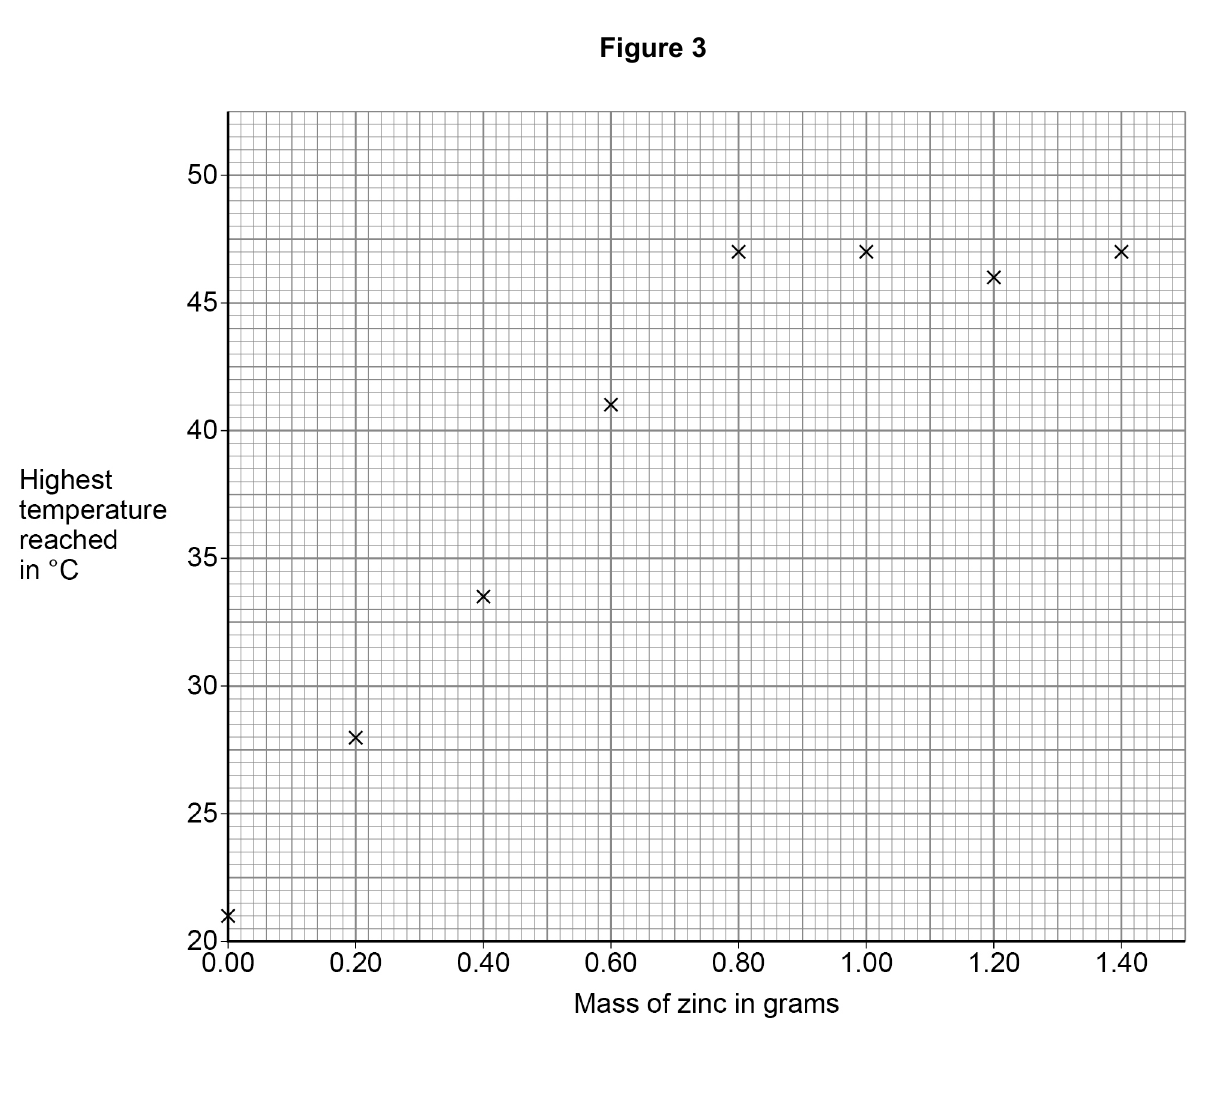
Explain the results shown in Figure 3. Do not refer to anomalous points. Use data from Figure 3.
Write your answer first. You can study the marking guidance whenever you need it.
Study the marking See what earns credit and compare it with a full-mark answer.
Marking points
- 1 Links the initial temperature rise to the exothermic reaction or transfer of energy to the surroundings.
- 2 Uses a valid graph value: the rise continues to about 0.8 g zinc or about 47 °C.
- 3 Explains that no additional reaction occurs after the intersection/plateau.
- 4 Identifies zinc as excess or copper sulfate as used up beyond the intersection.
Full-mark answer
As the mass of zinc increases, the highest temperature rises because the reaction is exothermic and transfers energy to the surroundings. The temperature rises to about 47 °C when about 0.8 g of zinc has been added. Adding more zinc then causes no further temperature rise because all the copper sulfate has reacted and the extra zinc is in excess.
Why this answer loses marks
The temperature rises and then stays constant.
That only describes the shape; add the exothermic cause, graph turning point and limiting-reactant explanation.