 Question Constellation Sign up for free
 AQA · GCSE · Physics · Higher
Activity from Decay Curve
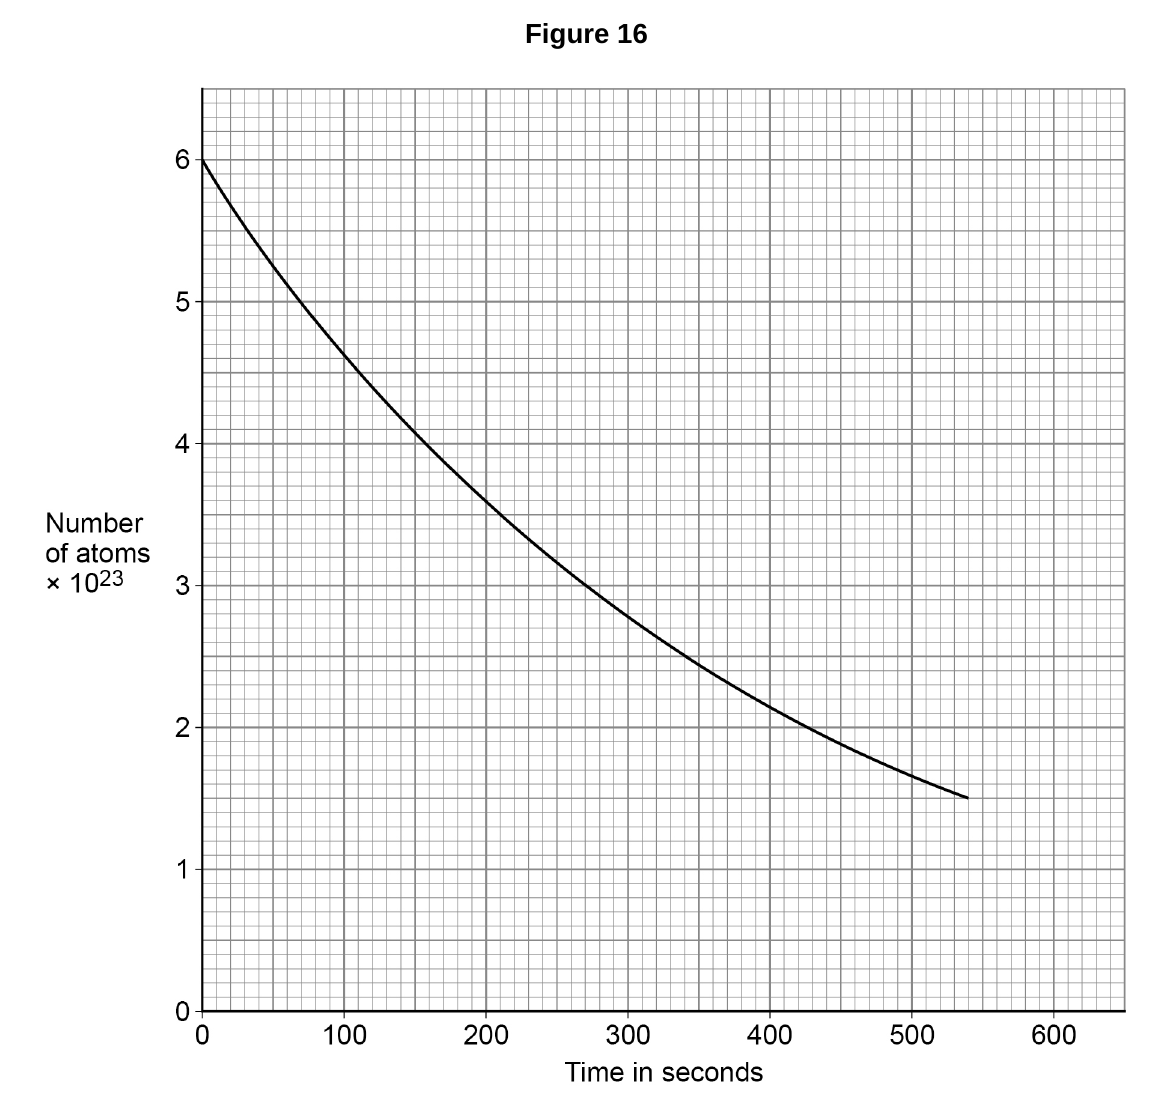
Figure 16 shows how the number of atoms of a radioactive element in a sample varied with time.
Activity is the rate at which a source of unstable nuclei decays.
Determine the activity of the radioactive sample at 300 seconds.
Give the unit.
Write your answer first. You can study the marking guidance whenever you need it.
Study the marking See what earns credit and compare it with a full-mark answer.
Marking points
- 1 Uses a valid tangent at 300 s to estimate the instantaneous gradient.
- 2 Calculates the magnitude of the tangent's gradient, accounting for the ×10^23 axis multiplier.
- 3 Obtains an activity in the allowed range 6.5 × 10^20 to 7.6 × 10^20.
- 4 Gives the unit Bq or becquerel.
Full-mark answer
Draw a tangent to the curve at 300 s and calculate the magnitude of its gradient. A suitable tangent gives a decrease of about 7.1 × 10^20 atoms each second, so the activity is approximately 7.1 × 10^20 Bq.
Why this answer loses marks
I read the curve value at the stated time and called that the activity.
Activity is a rate, not the number of atoms. Draw a tangent at the stated time and use the magnitude of its gradient with the correct unit.