 Question Constellation Sign up for free
 AQA · GCSE · Physics · Higher
Refraction Graph and Best-Fit Line
Figure 2 shows some of the results.
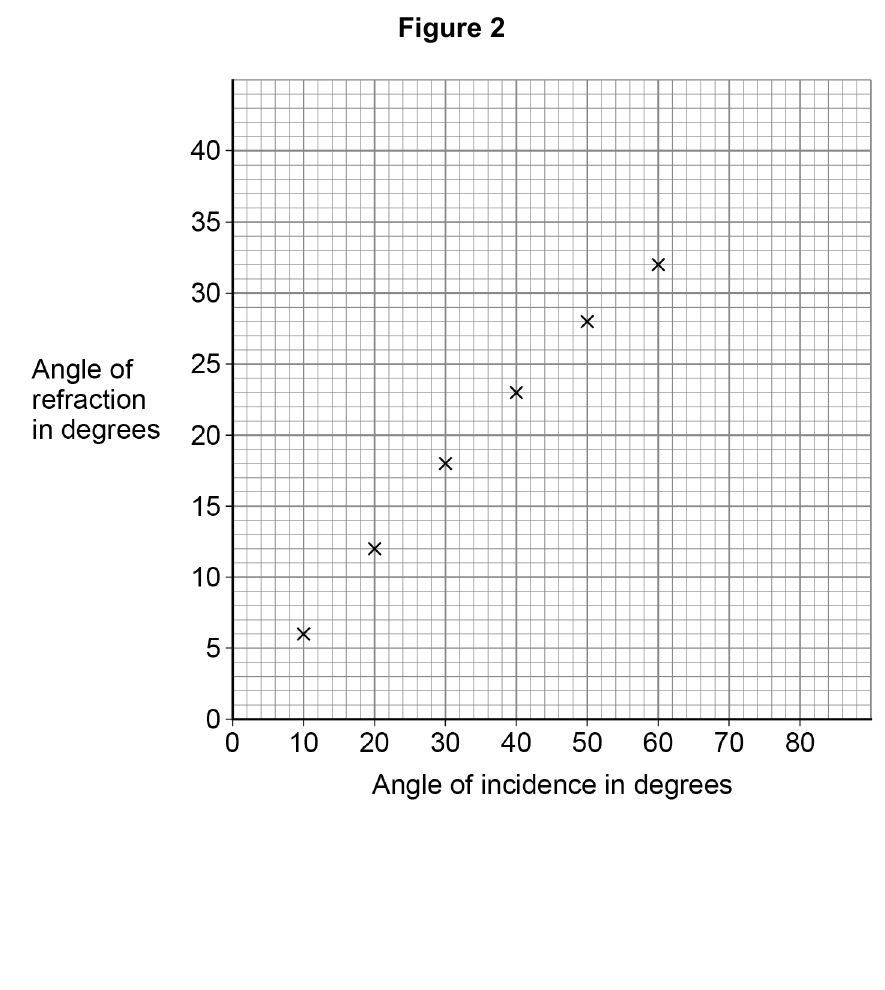
The student measured the angles of refraction for two additional angles of incidence. Table 2 shows the additional results.
| Angle of incidence in degrees | Angle of refraction in degrees |
|---|---|
| 70 | 35 |
| 80 | 37 |
Complete Figure 2. You should:
- plot the results from Table 2
- draw the line of best fit.
Practice unavailable
This question can be viewed, but its original response format is not available for practice yet.
Write your answer first. You can study the marking guidance whenever you need it.
Study the marking See what earns credit and compare it with a full-mark answer.
Marking points
- 1 Plots the two Table 2 points correctly within the stated tolerance.
- 2 Draws a suitable curve through the points.
Why this answer loses marks
Plots the extra points and joins every point with straight segments.
The plotted coordinates earn one mark, but the second mark needs one suitable best-fit curve rather than a dot-to-dot line.