 Question Constellation Sign up for free
 AQA · GCSE · Physics · Higher
Distance from a Velocity–Time Graph
Figure 12 shows a velocity–time graph for a train travelling between two stations.
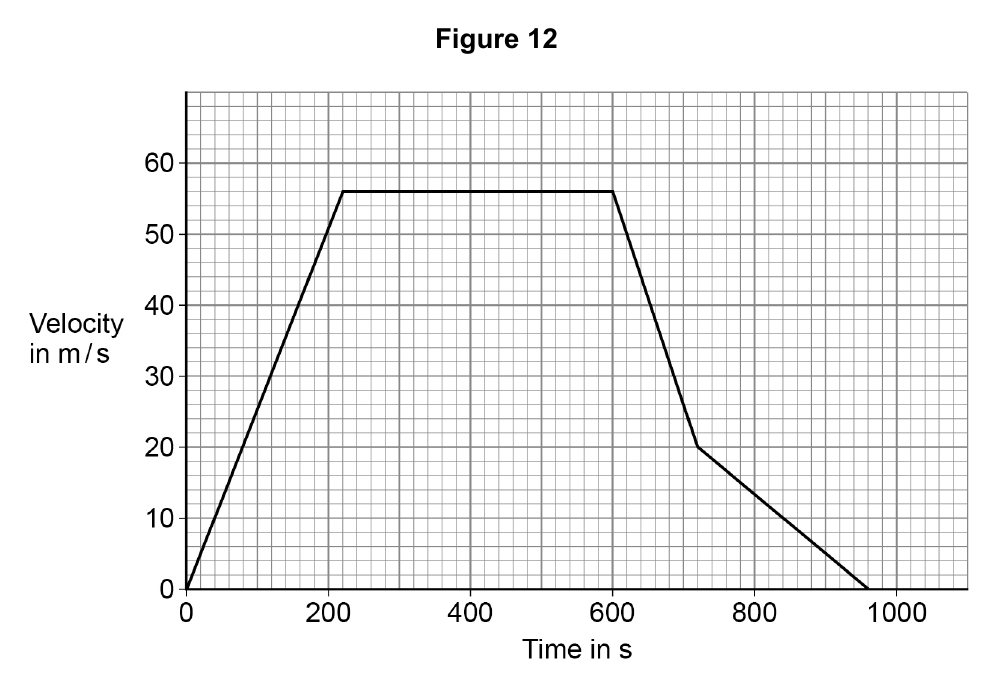
Determine the distance travelled by the train in the first 600 s of the journey.
Write your answer first. You can study the marking guidance whenever you need it.
Study the marking See what earns credit and compare it with a full-mark answer.
Marking points
- 1 Calculates the triangular area under the acceleration section.
- 2 Calculates the rectangular area under the constant-velocity section to 600 s.
- 3 Adds the component areas to give 27 440 m, with official consequential marking.
Full-mark answer
Distance is the area under the graph. Triangle: ½ × 56 × 220 = 6160 m. Rectangle: 56 × (600 − 220) = 56 × 380 = 21 280 m. Total = 27 440 m.
Why this answer loses marks
Uses only the rectangular part under the graph.
The requested interval also includes the initial triangular area, and both component areas must be added.