 Question Constellation Sign up for free
 AQA · GCSE · Physics · Higher
Graph Gradient, Deceleration and Braking Force
Figure 12 shows a velocity–time graph for a train travelling between two stations.
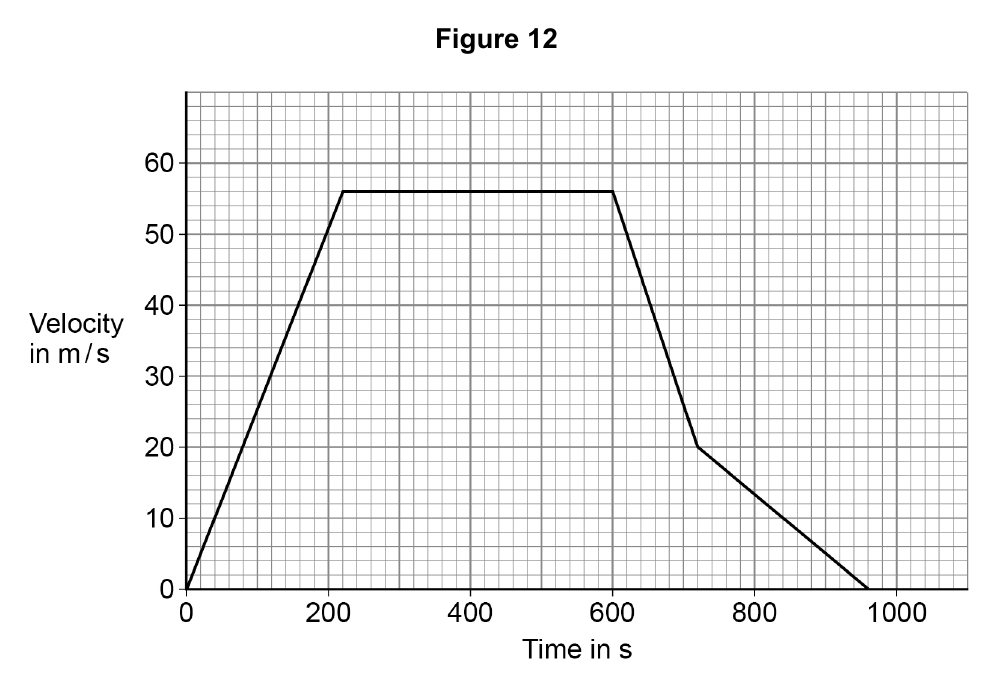
Explain what happens to the braking force as the train decelerates. Use information from Figure 12.
Write your answer first. You can study the marking guidance whenever you need it.
Study the marking See what earns credit and compare it with a full-mark answer.
Marking points
- 1 Uses Figure 12 to identify the smaller gradient after 720 s / after the speed reaches 20 m/s.
- 2 Links the smaller gradient to smaller deceleration.
- 3 Links smaller deceleration to a smaller braking force.
Full-mark answer
After about 720 s the graph has a smaller negative gradient, so the train's deceleration is smaller. For the same train mass, a smaller deceleration means the braking force is smaller.
Why this answer loses marks
The braking force stays constant because each section is straight.
Straight sections each show constant deceleration, but their different gradients show different deceleration magnitudes and braking forces.