 Question Constellation Sign up for free
 AQA · GCSE · Physics · Higher
Maximum Deceleration from Graph Gradient
Figure 12 shows a velocity–time graph for a train travelling between two stations.
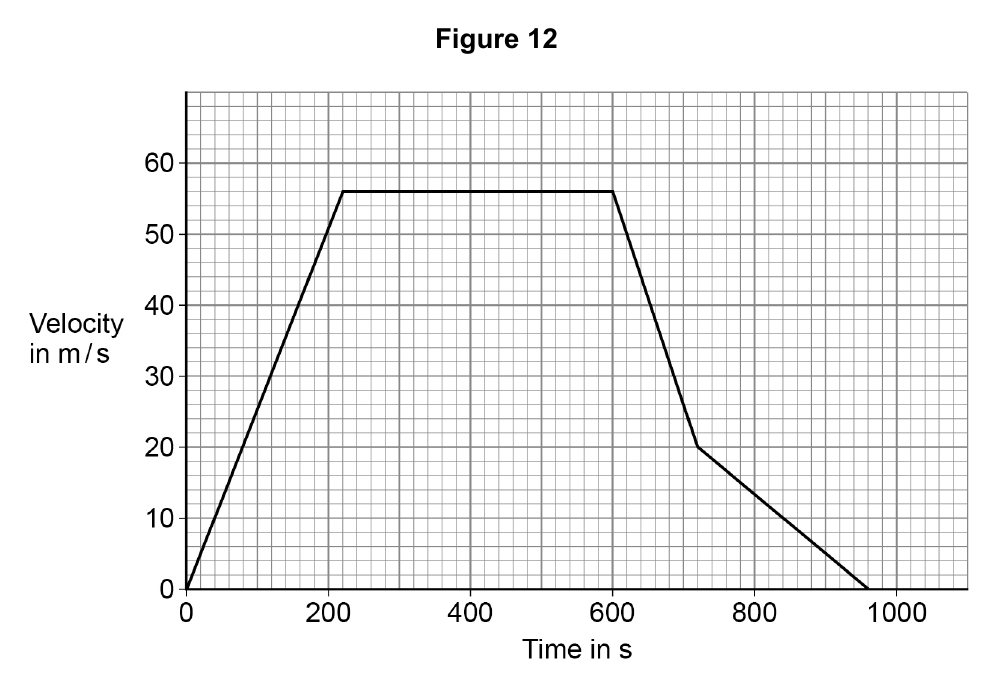
Determine the maximum deceleration of the train.
Write your answer first. You can study the marking guidance whenever you need it.
Study the marking See what earns credit and compare it with a full-mark answer.
Marking points
- 1 Chooses the steepest deceleration section.
- 2 Calculates the gradient from appropriate graph values.
- 3 Gives the maximum deceleration as 0.3 m/s² in magnitude.
Full-mark answer
The steepest deceleration is from 600 s to 720 s, where velocity falls from 56 m/s to 20 m/s. a = Δv/Δt = (20 − 56)/(720 − 600) = −36/120 = −0.3 m/s², so the maximum deceleration is 0.3 m/s².
Why this answer loses marks
Uses the gradient across the whole braking region.
Maximum deceleration requires the steepest individual section, not an average across sections with different slopes.