 Question Constellation Sign up for free
 AQA · GCSE · Combined Science · Higher
Explaining a non-zero graph intercept
Figure 5 shows how the mass of water in the kettle affected the time taken for the kettle to switch off.
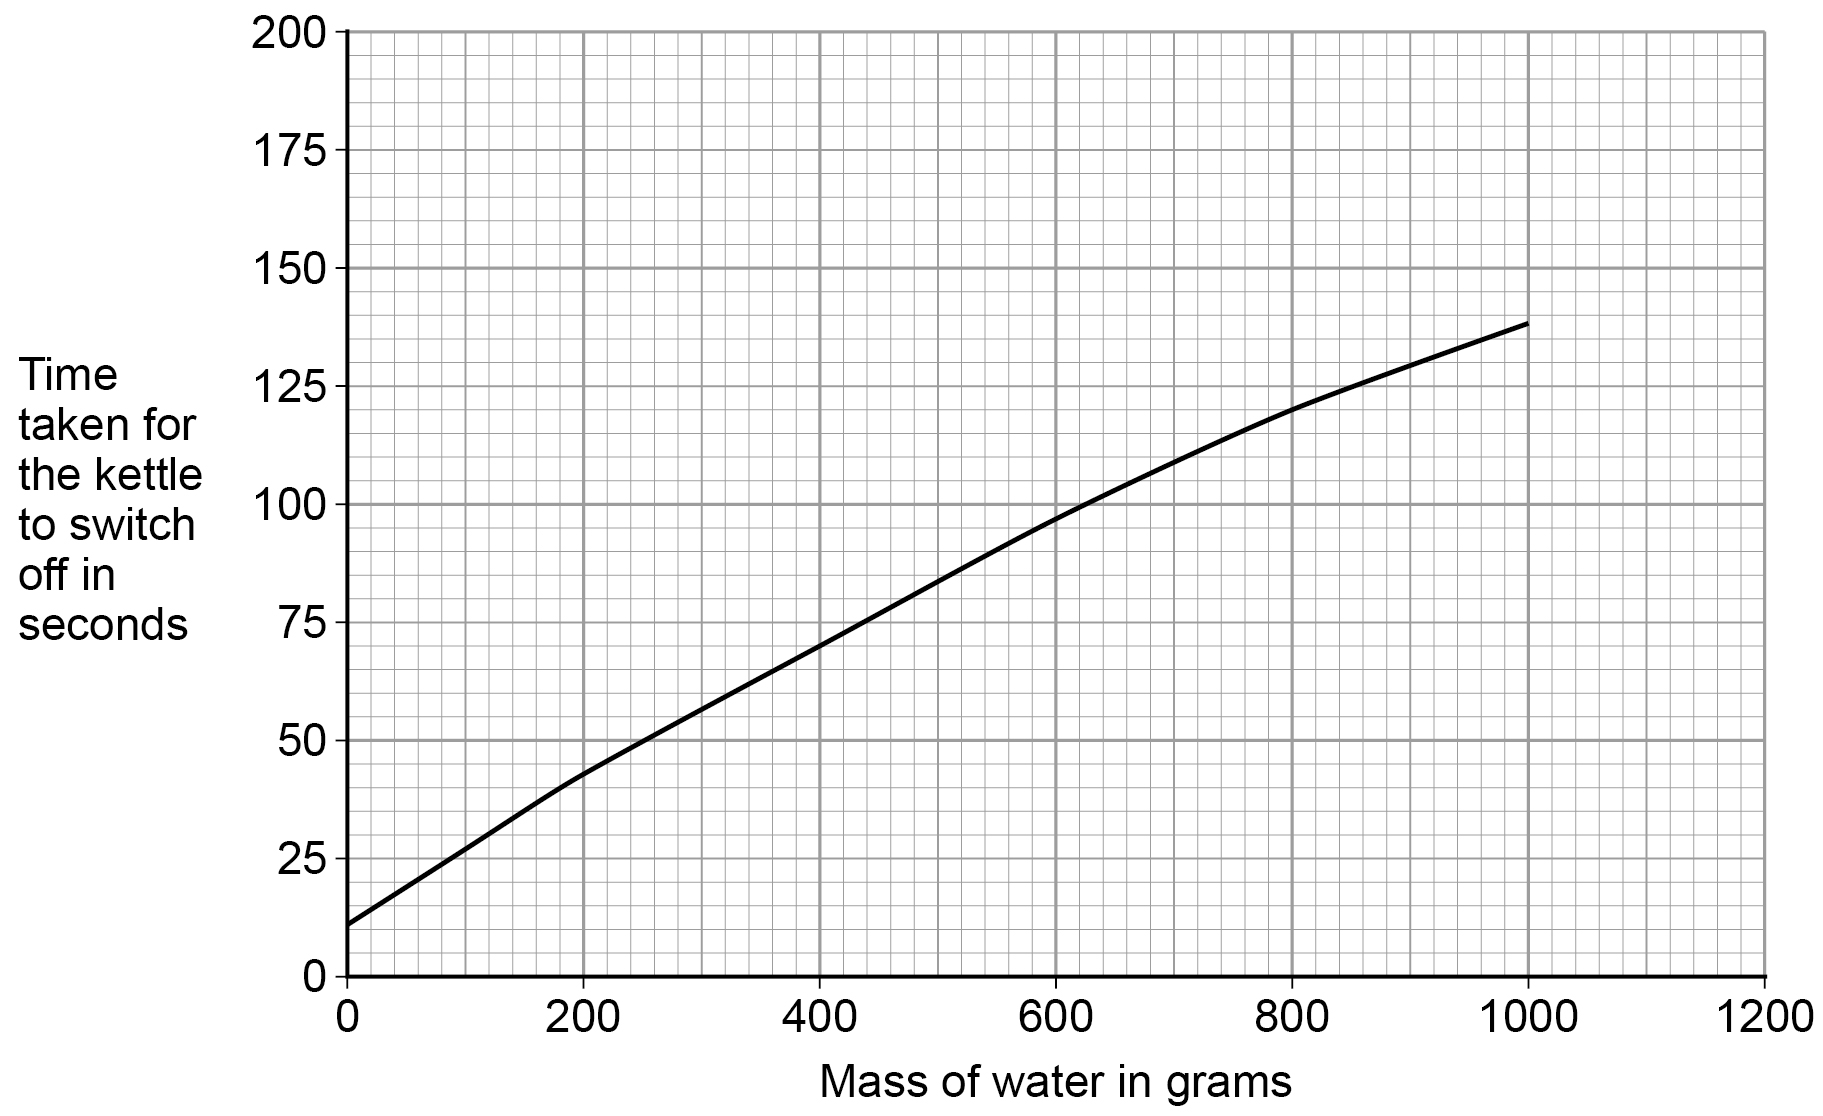
Suggest why the line on Figure 5 does not go through the origin.
Write your answer first. You can study the marking guidance whenever you need it.
Study the marking See what earns credit and compare it with a full-mark answer.
Marking points
- 1 Say that the heating element or kettle itself took time to heat up before heating the water sufficiently.
Full-mark answer
The kettle or heating element took time to heat up before it could heat the water, so the time was not zero even when extrapolated to zero mass of water.
Why this answer loses marks
Because the graph was drawn incorrectly.
The mark scheme credits the physical reason that the kettle or heating element takes time to heat up, not a generic graph-drawing comment.