 Question Constellation Sign up for free
 AQA · GCSE · Combined Science · Higher
Non-linear kettle heating results
Figure 5 shows how the mass of water in the kettle affected the time taken for the kettle to switch off.
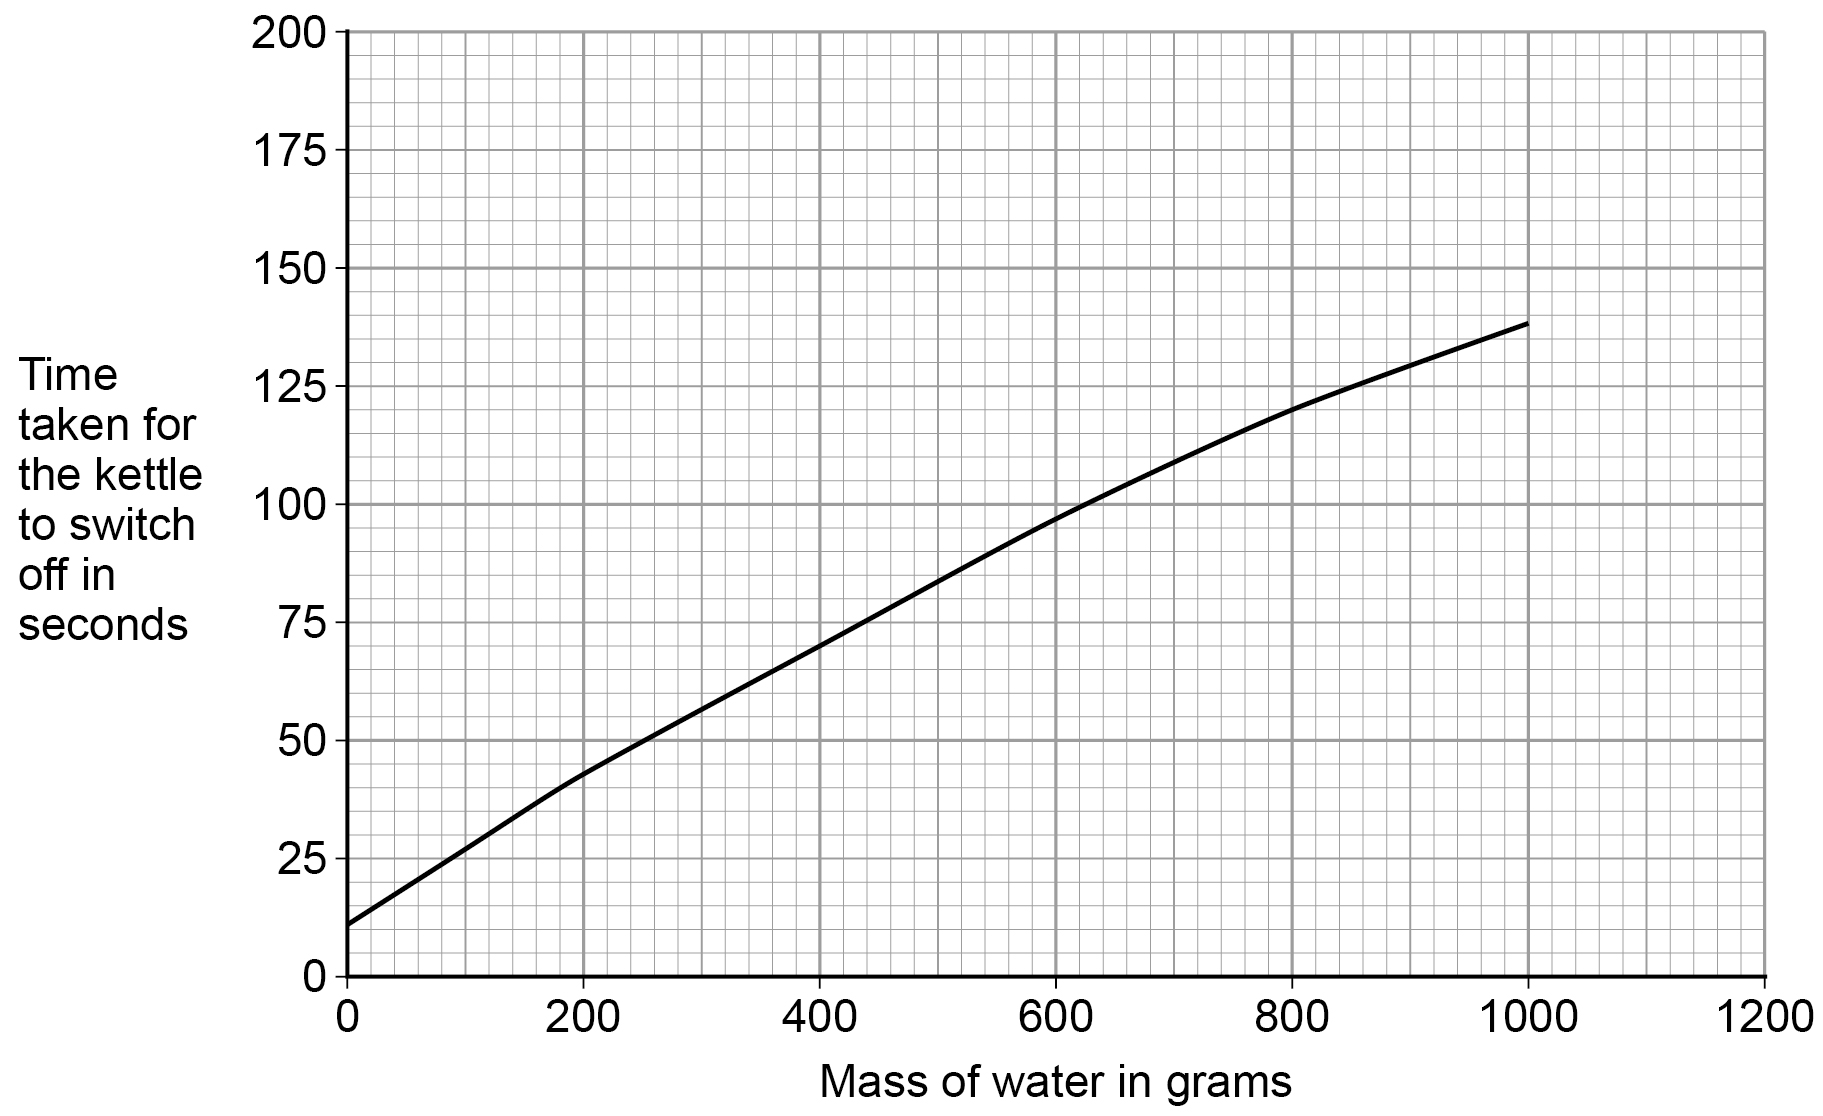
Suggest why the results give a non-linear pattern.
Write your answer first. You can study the marking guidance whenever you need it.
Study the marking See what earns credit and compare it with a full-mark answer.
Marking points
- 1 State that as the mass of water increases, the rate of energy transfer to the surroundings per kg of water decreases.
- 2 Or state that as the mass of water increases, the kettle becomes more efficient.
Full-mark answer
As the mass of water increases, less energy is transferred to the surroundings per kg of water, so the time does not increase in direct proportion to the mass.
Why this answer loses marks
Because the graph curves.
This describes the pattern but does not give a physical reason for it.