 Question Constellation Sign up for free
 AQA · GCSE · Combined Science · Higher
Graph gradient and changing resultant force
Figure 10 shows how the velocity of a car changes during braking.
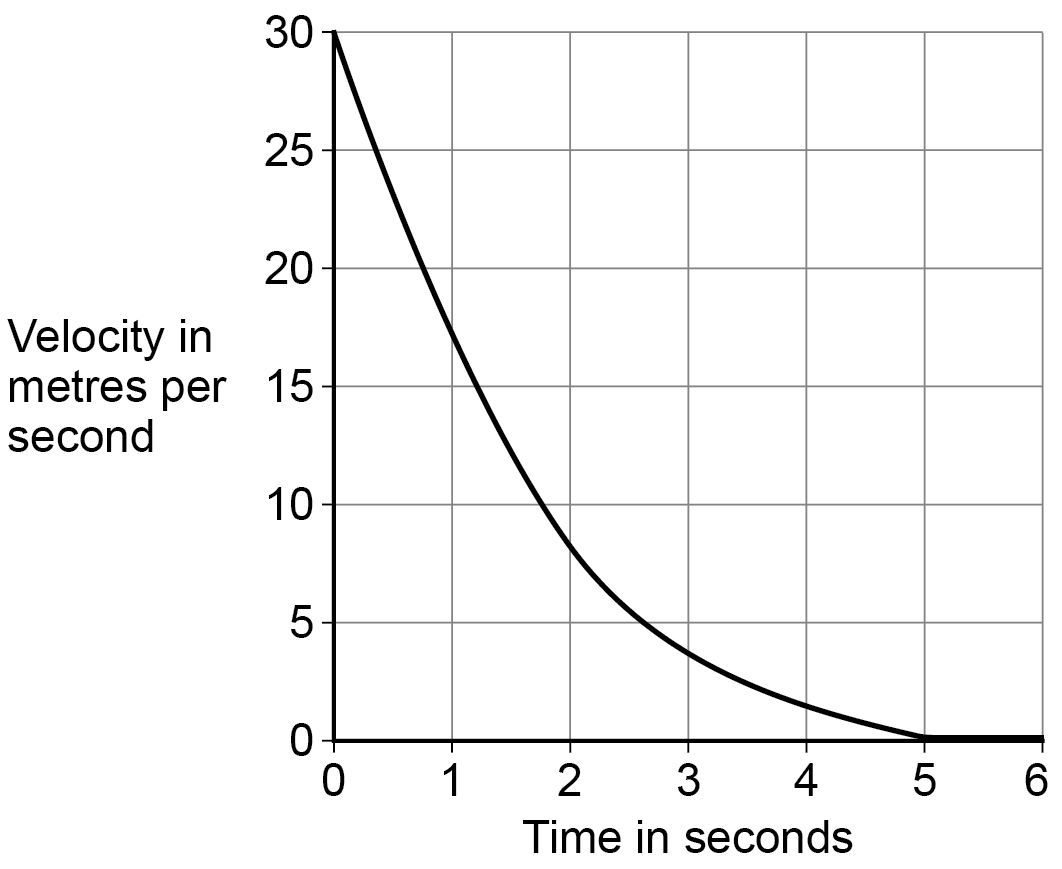
Explain how the gradient of the line on Figure 10 shows that the resultant force on the car was not constant.
Write your answer first. You can study the marking guidance whenever you need it.
Study the marking See what earns credit and compare it with a full-mark answer.
Marking points
- 1 State that the gradient of a velocity-time graph is the acceleration.
- 2 Use the curved graph to say that the gradient, and therefore the acceleration, is not constant.
- 3 Link this to resultant force using : for a constant mass, a changing acceleration means a changing resultant force.
Full-mark answer
The gradient of a velocity-time graph is the acceleration. The line in Figure 10 is curved, so its gradient and the car’s acceleration are not constant. Since , and the car’s mass is constant, a non-constant acceleration means the resultant force is not constant.
Why this answer loses marks
The velocity is decreasing so the force is not constant.
A decreasing velocity does not by itself show that the force is not constant; the key evidence is the changing gradient, which means changing acceleration.