 Question Constellation Sign up for free
 AQA · GCSE · Combined Science · Higher
Temperature-pressure graph relationship
A student investigated how the pressure of a gas depends on its temperature. The volume of the gas did not change.
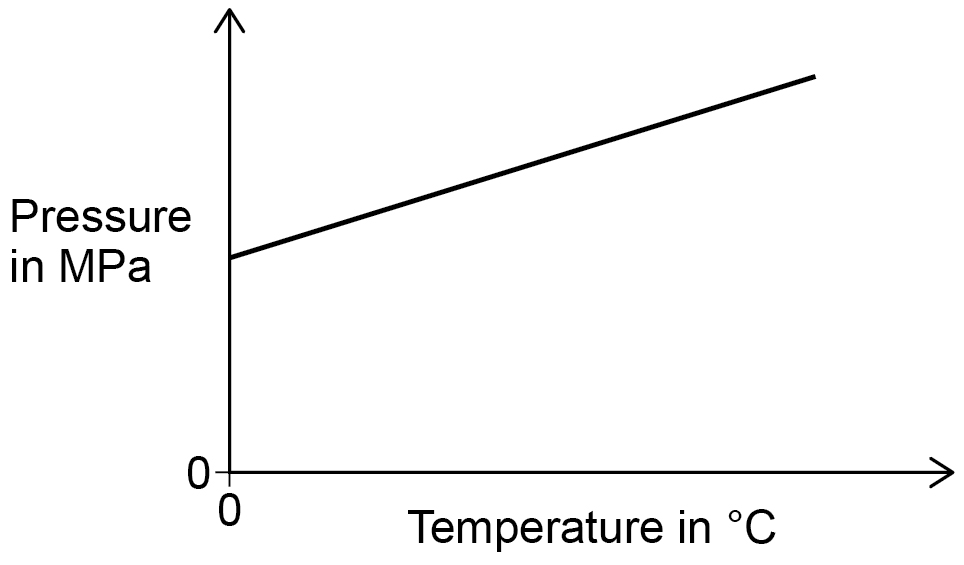
Figure 7 shows a sketch graph of the results.
The student said that as the temperature increases the pressure increases.
Give a better description of the relationship between temperature and pressure.
Write your answer first. You can study the marking guidance whenever you need it.
Study the marking See what earns credit and compare it with a full-mark answer.
Marking points
- 1 Describe the relationship as linear, or as having a constant gradient.
Full-mark answer
The relationship between temperature and pressure is linear.
Why this answer loses marks
Pressure is directly proportional to temperature.
The mark scheme does not accept directly proportional because the sketch line does not pass through the origin.