 Question Constellation Sign up for free
 AQA · GCSE · Combined Science · Higher
Deceleration of the car calculation
A car contains a device called a black box. The black box records the velocity and acceleration of the car. The car was travelling at a constant velocity. The driver then reacted to a hazard. Figure 11 shows the velocity–time graph for the car.
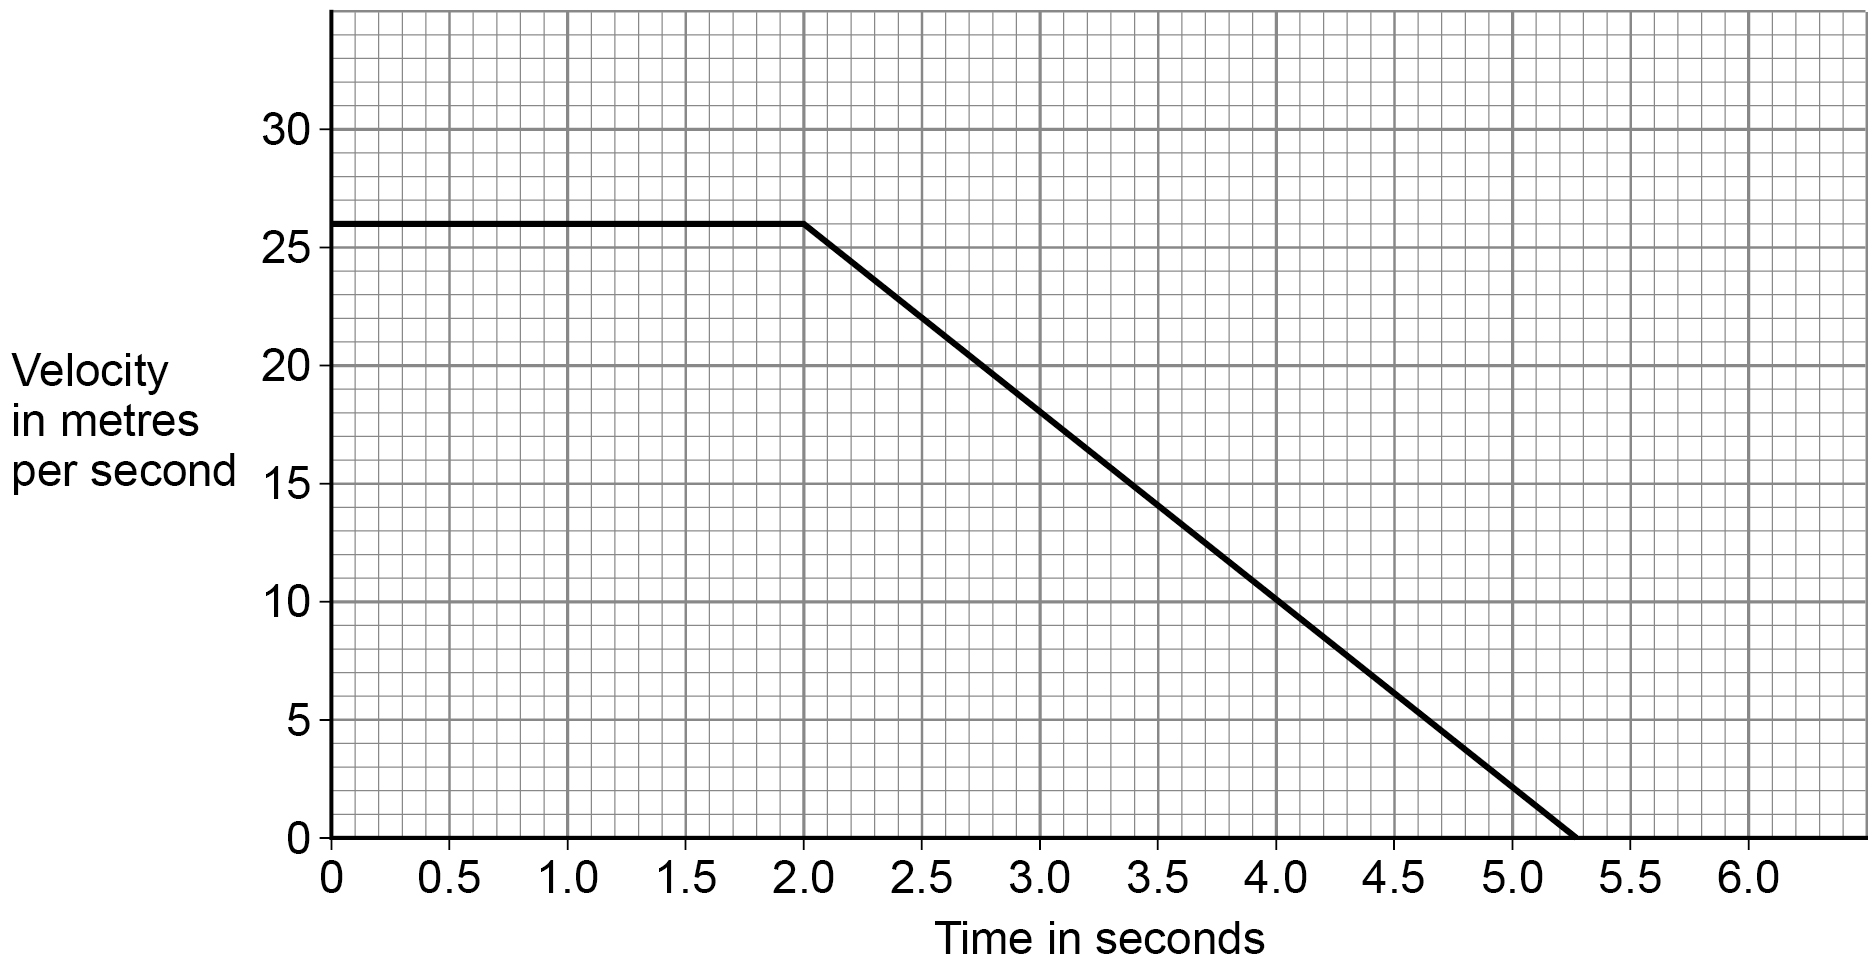
Determine the deceleration of the car.
Give the unit.
Write your answer first. You can study the marking guidance whenever you need it.
Study the marking See what earns credit and compare it with a full-mark answer.
Marking points
- 1 Read two suitable points from the sloping section of the velocity–time graph and use change in velocity divided by change in time.
- 2 Calculate the deceleration as or .
- 3 Give the unit as .
Full-mark answer
From the graph, the velocity changes from about to between and . Therefore , so the deceleration is .
Why this answer loses marks
The numerical value is correct, but the unit is velocity rather than acceleration.