 Question Constellation Sign up for free
 AQA · GCSE · Combined Science · Higher
Reaction time and thinking distance
Figure 8 shows the distance-time graph for a car travelling at .
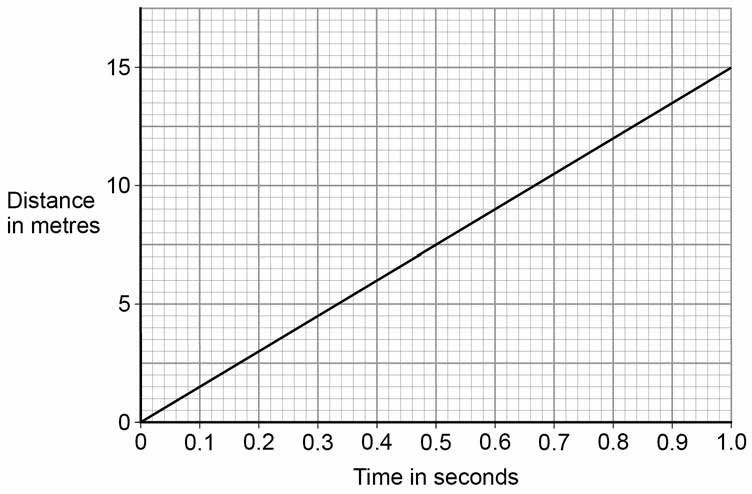
When the driver is tired, his reaction time increases from to . Determine the extra distance the car would travel before the driver starts braking.
Write your answer first. You can study the marking guidance whenever you need it.
Study the marking See what earns credit and compare it with a full-mark answer.
Marking points
- 1 Find the increase in reaction time, , or use the graph to find the two corresponding distances.
- 2 Calculate the extra distance as , or subtract the graph distances to get about .
Full-mark answer
The reaction time increases by . At , the extra distance is .
Why this answer loses marks
This gives the full thinking distance for the tired driver, not the extra distance compared with .