 Question Constellation Sign up for free
 AQA · GCSE · Combined Science · Higher
Speed, thinking distance and braking distance
Figure 9 shows how the thinking distance, braking distance and stopping distance for a car vary with the speed of the car.
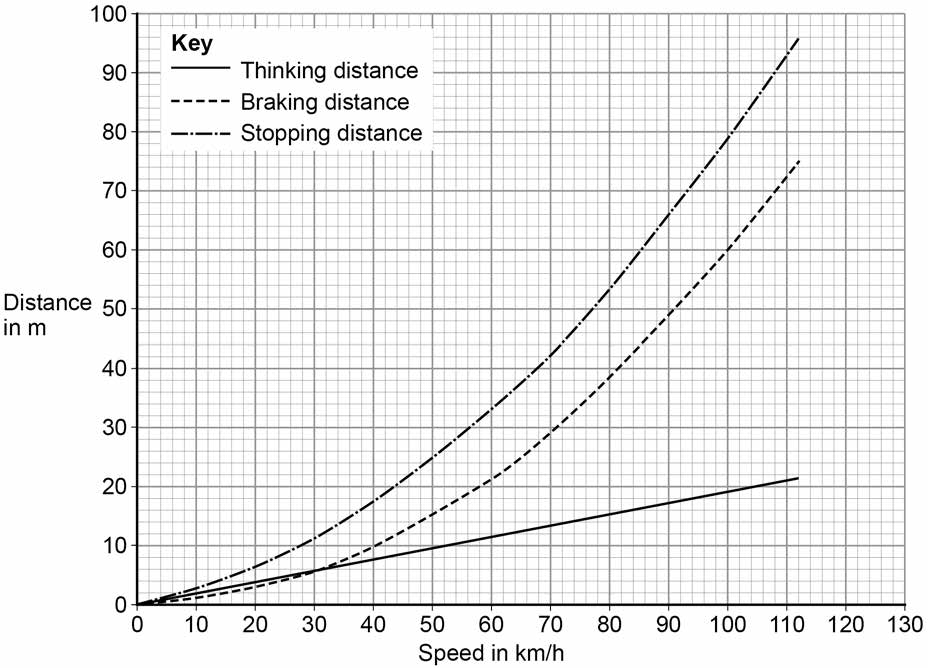
Describe the relationships shown in Figure 9. You should include factors that would affect the gradient of the lines.
Write your answer first. You can study the marking guidance whenever you need it.
Study the marking See what earns credit and compare it with a full-mark answer.
Marking points
- 1 Describe the thinking-distance line: thinking distance increases with speed and is directly proportional to speed.
- 2 Give factors that increase thinking distance and its gradient, such as drugs, alcohol, tiredness or distractions.
- 3 Describe the braking-distance line: braking distance increases with speed and increases at an increasing rate.
- 4 State that braking distance is directly proportional to speed squared.
- 5 Give factors that increase braking distance and its gradient, such as poor brakes, poor tyres, wet or icy roads, or greater mass.
- 6 State that stopping distance is the sum of thinking distance and braking distance.
- 7 Describe the stopping-distance line: it increases at an increasing rate with speed.
- 8 Explain that factors increasing either thinking distance or braking distance would increase the gradient of the stopping-distance line.
Full-mark answer
The thinking distance increases in direct proportion to speed, so its graph is a straight line. Drugs, alcohol, tiredness and distractions increase reaction time, so they increase the thinking distance and make the thinking-distance line steeper. The braking distance also increases with speed, but at an increasing rate; it is proportional to speed squared. Poor brakes, poor tyres, wet or icy roads and greater mass increase braking distance and make the braking-distance curve steeper. The stopping distance is the thinking distance plus the braking distance, so it also increases at an increasing rate, and any factor that increases thinking or braking distance increases the stopping distance.
Why this answer loses marks
Thinking distance and braking distance are both directly proportional to speed.
Thinking distance is directly proportional to speed, but braking distance increases at an increasing rate and is proportional to speed squared.