 Question Constellation Sign up for free
 AQA · GCSE · Geography · Higher
Regional House Price and Income Relationship
Study Figure 1 in the resources booklet, ‘England’s housing challenge’.
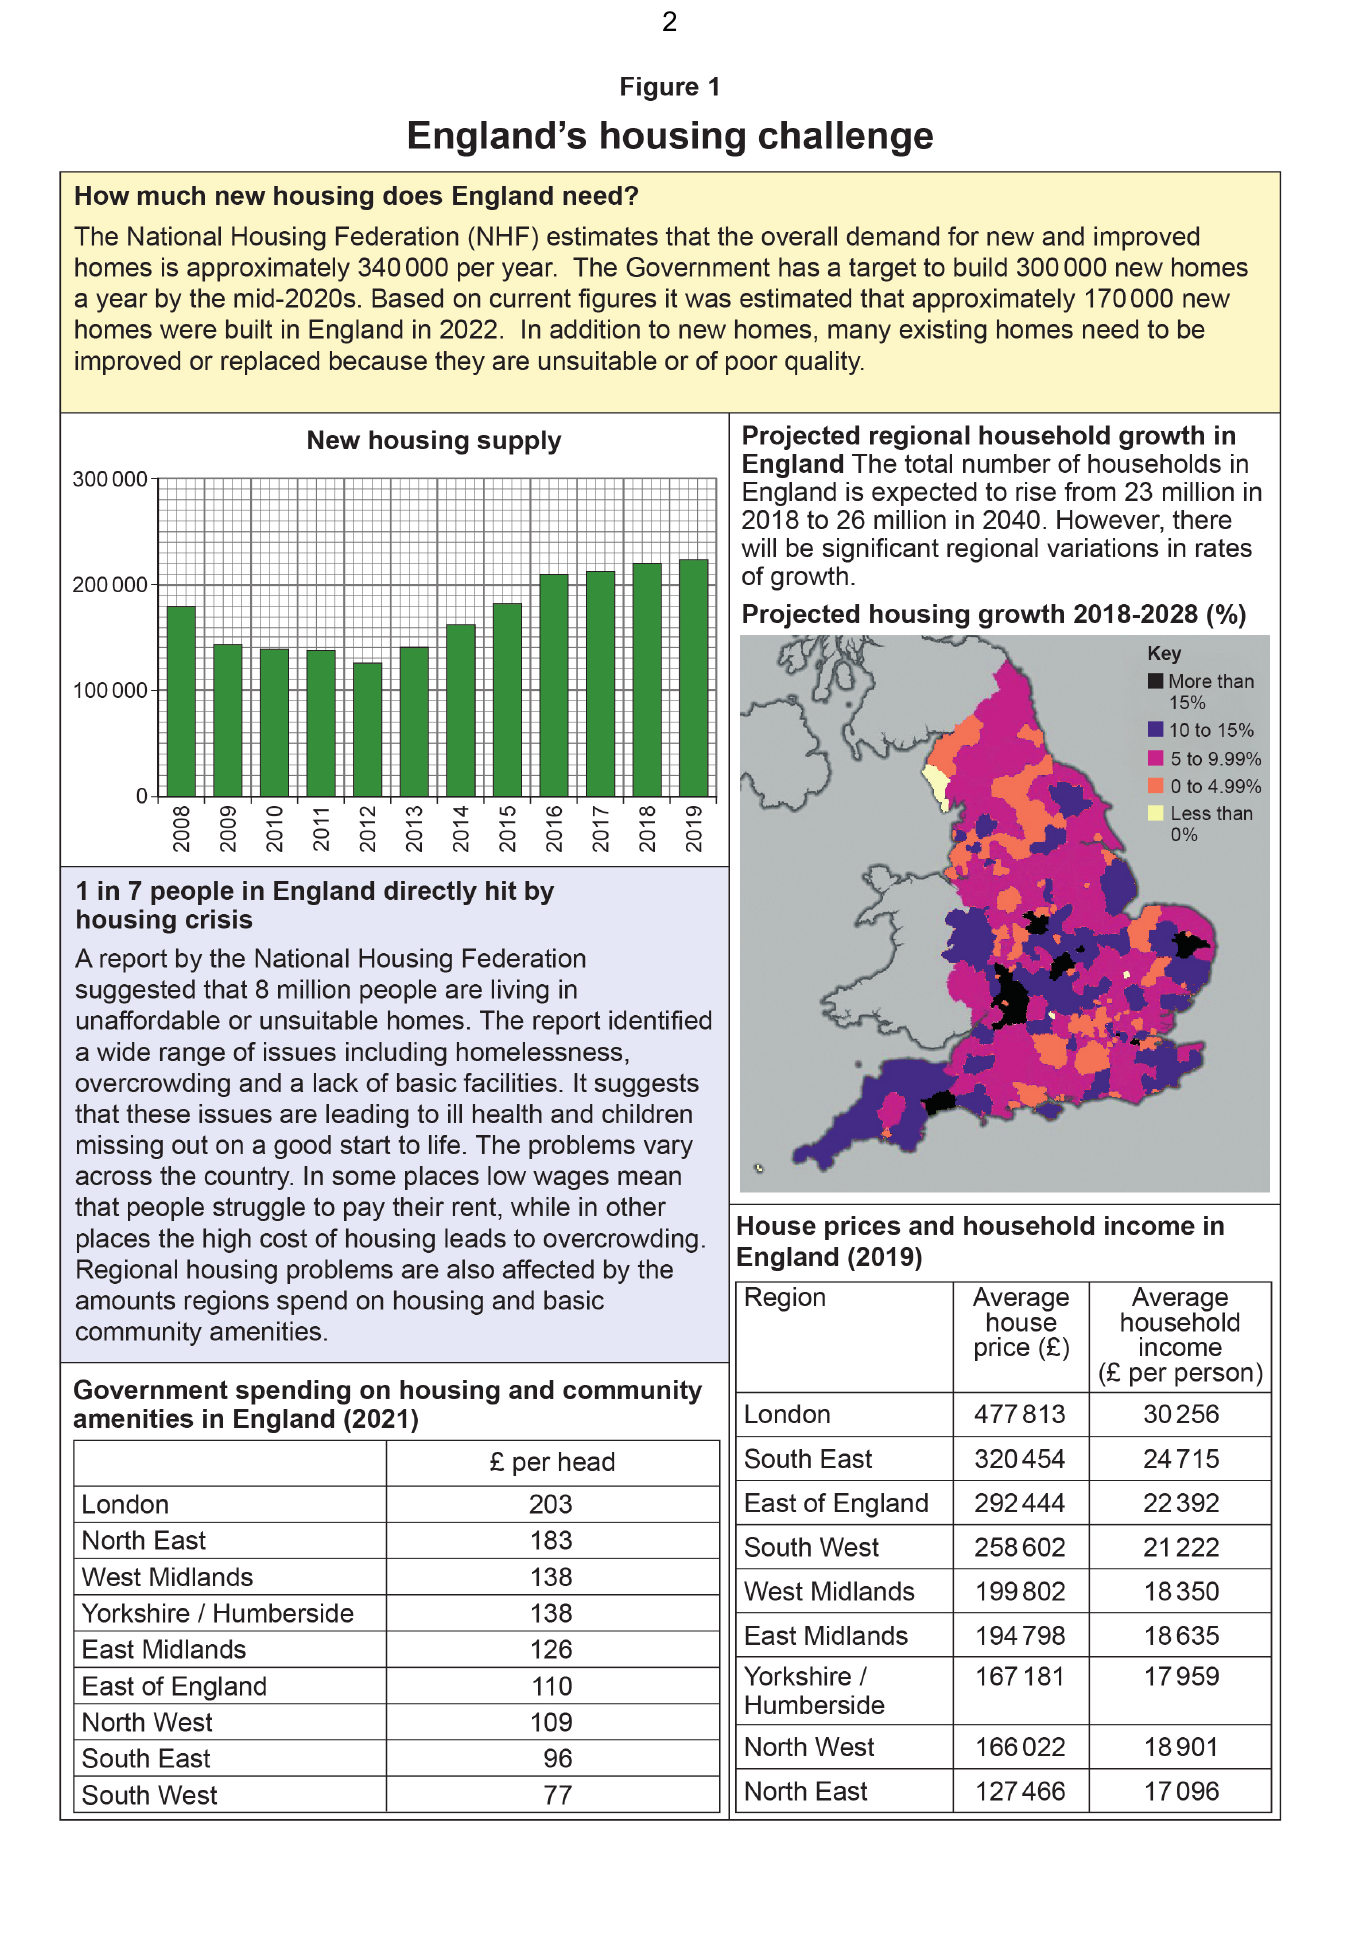
Describe the relationship between average house prices and average household income in England (2019).
Write your answer first. You can study the marking guidance whenever you need it.
Study the marking See what earns credit and compare it with a full-mark answer.
Marking points
- 1 States the overall positive relationship between income and house price.
- 2 Supports or qualifies the relationship using precise Figure 1 evidence or an anomaly/multiple comparison.
Full-mark answer
In general, English regions with higher average household incomes also have higher average house prices. For example, London has the highest figures in the table (about £477,813 and £30,256), whereas the North East is much lower (about £127,466 and £17,096), although the regional rankings are not identical.
Why this answer loses marks
House prices and household incomes are different in every region.
This does not state the overall positive relationship or support it with a precise regional comparison, anomaly or ratio from Figure 1.